How Real Estate Agents Track Which Yard Signs Actually Work
Published on by Emilie
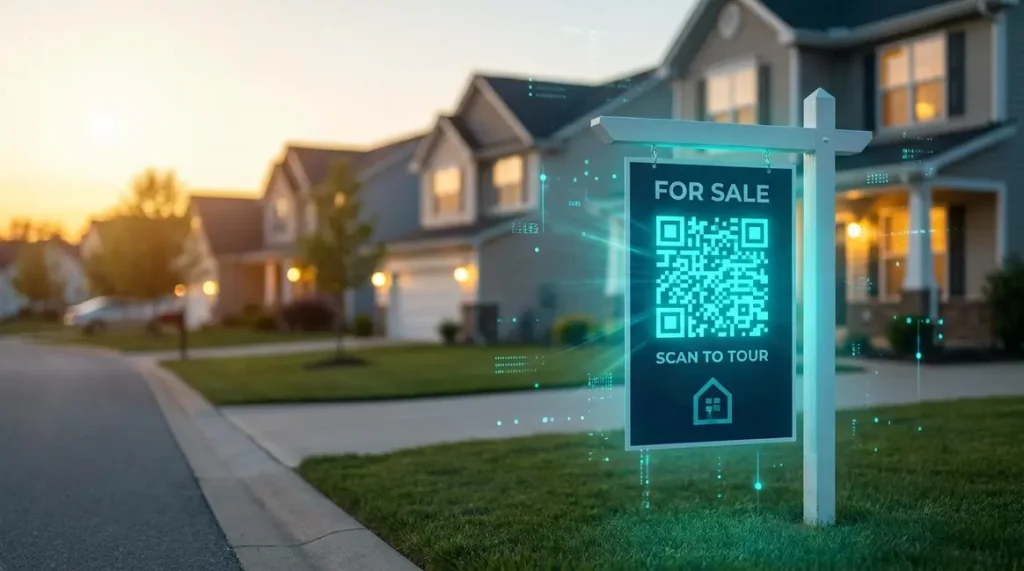
A real estate agent in Phoenix puts up 47 yard signs across three neighborhoods. Twelve weeks later, she closes two deals. Which signs actually drove traffic? Which neighborhoods engaged? She has no idea. Most agents treat yard signs as a necessary expense with unmeasurable results, but real estate yard sign tracking with QR codes and demographic analytics turns guesswork into data you can actually use.
Why Traditional Yard Sign Metrics Don’t Tell You Anything
You know how many signs you printed. You might know how many calls came into your main number. But you don’t know which sign in which location generated interest from qualified buyers versus tire-kickers. You’re measuring inputs (signs placed) and outcomes (closings), with a complete black box in between.
The standard approach is to put a phone number or website on the sign and hope people remember where they saw it. When someone calls, you ask “how did you hear about us?” and get answers like “I saw your sign somewhere” or “I think it was online.” Not useful when you’re trying to decide whether the sign at the corner of Maple and 5th is worth $200 or whether that upscale neighborhood actually converts.
This is where QR code yard signs change everything. Instead of a generic website URL, each sign gets a unique trackable link encoded in a QR code. Scan the code, get property details, and the agent gets granular data about who scanned, where they were, and what demographics they represent.
The Right Way to Set Up Real Estate Yard Sign Tracking
Here’s the infrastructure that actually works. Each property listing gets its own shortened URL that redirects to your listing page, virtual tour, or lead capture form. Print that URL as a QR code on the yard sign. Size matters: make it at least 2×2 inches so someone in a car moving 25mph can scan it from the curb.
Use a URL shortener that captures device type, timestamp, and location data. The shortened link should be simple enough to type manually (blrb.ai/oakst427 works better than blrb.ai/xK9mQ2pR), but the QR code does most of the heavy lifting.
Each sign becomes a data collection point. You now know:
- Exact scan timestamps (are people scanning during morning commutes or weekend afternoon drives?)
- Device types (iPhone vs Android tells you something about income levels)
- Zip codes where scanners live (are locals browsing or are people coming from across town?)
- Return visits (did they scan once out of curiosity or come back three times?)
The key is using zip code level click analytics rather than just city-level data. Knowing someone scanned from “Austin” is useless. Knowing they scanned from 78703 (median household income $126,000, 71% homeownership rate) versus 78741 (median income $52,000, 38% homeownership) tells you whether that sign is reaching qualified buyers or renters browsing out of curiosity.
What the Data Actually Reveals About Sign Performance
After tracking 200+ signs across different neighborhoods, patterns emerge fast. Signs on corner lots with stop signs generate 3-4x more scans than mid-block placements. Signs visible from both directions of traffic outperform single-direction visibility by roughly 60%. None of this is revolutionary, but you can’t optimize what you don’t measure.
More interesting: the demographic breakdown of who scans varies dramatically by placement location. A sign in a zip code with 85% homeownership might generate 40 scans, but only 8 from people who live outside that immediate area. Those 8 external scans are your actual buyer prospects. The 32 local scans are neighbors being nosy. Both are useful data points, but for different reasons.
Time-based patterns matter too. Luxury listings ($800k+) see peak scan activity on Saturday and Sunday afternoons. Starter homes ($250k-400k) get scanned heavily during weekday evening commutes (5:30-7pm) and lunch breaks (11:30am-1pm). This tells you when your target buyers are actively looking and when you should schedule open houses or follow-up outreach.
Return scan behavior separates casual browsers from serious prospects. Someone who scans once and never returns has a sub-5% conversion rate to showing request. Someone who scans, returns two days later, and scans again from a different location (showing the link to a partner or family member) converts at 23%. You can’t see this pattern without tracking individual shortened URLs over time.
Demographic Data Turns Scan Counts Into Marketing Intelligence
Raw click counts are a starting point, not an answer. Knowing your yard sign got 60 scans means nothing without context. Are those scans from people with the income to qualify for a mortgage? Are they coming from renters exploring homeownership or existing homeowners looking to upgrade?
This is where Census-based demographic overlays become critical. When you map QR code scans to zip code demographics, you see:
- Median household income in the scanner’s home zip code
- Homeownership vs rental rates
- Education levels (bachelor’s degree or higher percentages)
- Age distribution (are you reaching first-time buyers in their 30s or empty nesters in their 60s?)
A condo listing in downtown Seattle might generate 90 scans. Demographic breakdown shows 67 scans from zip codes with median income under $65k and 75%+ rental rates. Those aren’t your buyers for a $550k condo. The 23 scans from zip codes with $95k+ median income and 60%+ homeownership rate? Those are qualified prospects worth immediate follow-up.
You can also spot migration patterns. If a listing in suburban Denver keeps getting scanned by people from California zip codes with high incomes and home equity, you’re seeing out-of-state buyers researching relocation. Adjust your marketing copy to address their specific concerns (property taxes, commute times, school districts) rather than generic neighborhood features.
According to Census Bureau data, median household income can vary by 300% or more between zip codes in the same metro area. Treating all scans as equal is like treating all website traffic as equal. The agent who understands who is scanning will always outperform the agent who only knows how many scanned.
Geographic Heatmaps Show You Where Your Actual Buyers Live
Spreadsheets full of zip codes are useful if you enjoy pivot tables. Interactive heatmaps make the data immediately actionable. When you visualize geographic click tracking on a map, you see concentration patterns that would take hours to spot in raw data.
A listing in Charlotte generates scans from 34 different zip codes. The heatmap shows tight clustering in three specific areas: the immediate neighborhood (expected), an area 8 miles north near a major employer headquarters (interesting), and a suburb 15 miles south with excellent schools (very interesting). This tells you exactly where to focus your next round of digital ads, direct mail, or additional signage.
You can also identify dead zones. If you’re getting zero scans from an adjacent affluent neighborhood, that’s not bad luck. Either your sign placement isn’t visible to traffic from that direction, or buyers in that area are using different research channels (realtor referrals, exclusive listing services). Either way, you know not to waste marketing budget trying to reach them with more yard signs.
Heatmaps also reveal commute patterns. A sign on a major arterial road might generate scans heavily concentrated along that corridor, showing you exactly which neighborhoods see your sign during their daily drive. Place your next sign at a different chokepoint to reach a different audience rather than saturating the same eyeballs.
Comparing URL Shortener Options for Real Estate Marketing ROI
Not all link shorteners give you the data you need to measure real estate marketing ROI. Most track clicks but not demographics. Here’s what you actually get at different price points:
| Feature | Free Tools (Bitly Free, TinyURL) | Bitly Premium ($300/mo) | blrb.ai Pro ($5/mo) |
|---|---|---|---|
| Click counting | Yes | Yes | Yes |
| Device type | Yes | Yes | Yes |
| City-level location | Yes | Yes | Yes |
| Zip code-level tracking | No | No | Yes |
| Census demographic data (income, education, homeownership) | No | No | Yes |
| Interactive geographic heatmaps | No | Limited | Yes |
| Full CSV data export | No | Yes | Yes |
The pricing gap is absurd. Bitly Premium costs $300/month and still doesn’t give you zip code demographics or homeownership data. That’s $3,600/year for incomplete information. Meanwhile, tools built specifically to answer who clicks your links with demographic context cost $5/month.
For a real estate agent tracking 15-20 active listings with unique QR codes per sign, spending $300/month on link analytics makes no sense. Spending $5/month to know that your $450k listing is getting scanned primarily by people from zip codes with $120k+ median income and 80% homeownership rates? That’s a rounding error with massive strategic value.
Turning Yard Sign Data Into Actual Business Decisions
Data without action is just expensive trivia. Here’s how agents use yard sign tracking to change what they do:
Reallocate sign budget based on performance: If corner placements generate 4x more qualified scans (high-income zip codes, high homeownership rates) than mid-block placements, stop buying mid-block signs. Spend that budget on better corners or double up signage at top performers.
Adjust pricing strategy: If a listing generates high scan volume but scans come predominantly from zip codes with median income 40% below the listing price, you’re either overpriced or marketing to the wrong audience. If scans come from zip codes that can afford it but no one requests showings, your listing photos or description need work.
Target digital ads geographically: Export your scan data by zip code, identify the top 10 zip codes generating qualified traffic, and run Facebook or Google ads targeted exclusively to those areas. You’re not guessing which neighborhoods to target. You’re using revealed preference data from people who already showed interest.
Schedule open houses strategically: If your scan data shows peak activity on Sunday afternoons from high-income zip codes, schedule your open house Sunday 1-4pm and promote it specifically to those zip codes. If scans spike during weekday lunch hours from nearby office parks, consider a Thursday lunch-hour showing for local professionals.
Refine your listing inventory strategy: If you consistently see scans from first-time buyer zip codes (younger demographics, lower homeownership rates) on your starter home listings but very few scans from move-up buyers, you know your niche. Double down on inventory that matches your organic audience rather than chasing luxury listings that don’t align with who actually responds to your marketing.
One agent in Austin tracked 31 signs over four months and discovered that 78% of her qualified scans (defined as coming from zip codes with income sufficient to qualify for her listings) came from just 6 of her 31 sign placements. She discontinued the underperforming signs, reinvested that budget into digital ads targeted to the zip codes generating scans, and cut her cost per qualified lead by 53%.
Implementation Takes 15 Minutes Per Listing
The technical setup is trivial. Create a shortened URL for your listing page. Generate a QR code (any free QR generator works, or your URL shortener includes one). Send the QR code graphic to your sign printer with placement instructions (minimum 2×2 inches, high contrast). Done.
Your sign vendor can add QR codes to their standard templates for usually $10-15 per sign. Some vendors now offer QR codes as standard. If you’re printing signs yourself, add the QR code in the bottom corner with text like “Scan for details & virtual tour” or just “Scan here.”
Check your analytics weekly for the first month to establish baseline patterns, then monthly after that unless you’re running active campaigns. Export the data to CSV, filter by demographics, and identify your top-performing locations and highest-quality traffic sources.
The only ongoing cost is your URL shortener subscription. At $5/month for full demographic data and unlimited link tracking, the ROI calculation is simple: if better yard sign placement data helps you close one additional deal per year, you’ve made back 240 months of subscription fees.
Ready to see who’s really clicking? Start free with blrb.ai. Upgrade to Pro for $5/month for zip code demographics, interactive heatmaps, and full data export.